
Today I’m concluding my series on SQL Server execution plans by sharing the specific steps I take when troubleshooting a slow performing query. Miss the first 4 parts of this execution plans series? Check out part 1’s introduction to execution plans, part 2’s overview of statistics, and part 3’s explanation of how to read an execution plan, and part 4’s look at commonly troublesome operators).
Getting the Execution Plan
In part 1 of this series we discussed the different types of execution plans available and how to view them. My preference is to start with the poor performing query and request an execution plan for it.
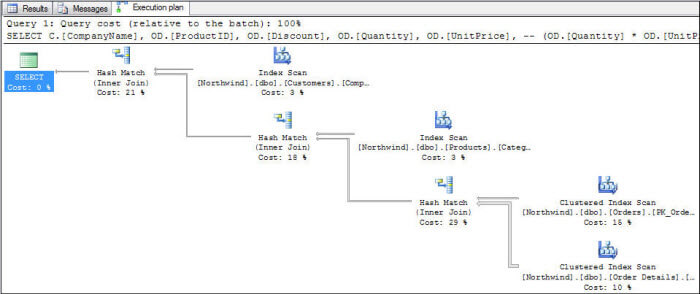
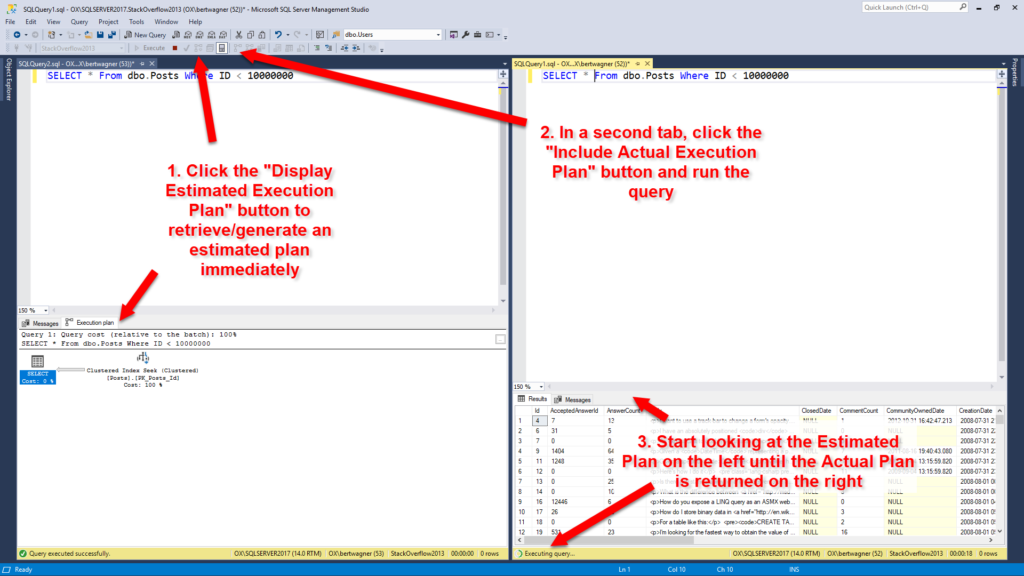
With the query pasted and formatted in my SSMS editor window, I like retrieving the estimated execution plan first, and then pasting the query into a second editor window and executing the query with the “Include Actual Execution Plan” option turned on. For bonus points, I’ll split the SSMS window vertically so I can start looking at the estimated execution plan while the query runs and returns the actual execution plan: I like this combination because I (almost) immediately receive my estimated execution plan and can start looking for problems. Once the query on the right finishes executing and I get the actual plan with all of its lovely run-time stats, I usually switch to that looking at that one homes for sale.
Some people take the opposite approach, looking at a cached query plan first before running the query to get a plan. This is fine too, but from my experience running the query first gives me some other data points to work with: is this query still running slowly, or was it a temporary issue? Did the person I’m reviewing the query for make some mistake and saw poor performance for some other unrelated reason? Getting the execution plan myself will help answer some of these questions.
But flaws exist with my process too. For example, running the query in an SSMS window may generate a new plan instead of reusing a cached plan (if something like white space is different between the two query texts). This is one of those things that is fine as long as you remember that’s what could be happening. It even acts as a benefit because if you do get different query plans between your run and what exists in cache, then you know you might have a parameter sniffing problem.
Finally, if the actual execution plan is impractical to retrieve (the query takes too long to run), then I will turn on Live Query Statistics: I don’t start with this option because most queries I deal with will return by the time I finish looking over the estimated execution plan (and at that point the additional overhead of Live Query Statistics isn’t worth it). But if I don’t have time to wait for the actual plan to return, switching to Live Query Statistics and watching the long running query execute in real time will usually help diagnose the performance issue.